FDA Nutrition Facts Label for Retirees: Your Best Guide to Eating Smarter
The nutrition facts label for retirees is one of the most powerful tools for eating well in retirement. Here’s how to actually read it — without the confusion.
Let’s walk through the nutrition facts label together — what each line actually means, which parts matter most in retirement, and how to use it to make smarter choices without turning every grocery trip into a homework assignment.
Key Takeaways
- The nutrition facts label for retirees is one of the most honest, useful tools in the grocery store — once you know how to read it.
- Always start with serving size. Everything else on the label is based on that number.
- Sodium, saturated fat, and added sugars deserve extra attention in retirement — they’re the quiet culprits behind many age-related health concerns.
- Fiber and protein are your friends. More of both usually means a more satisfying, health-supporting meal.
- The % Daily Value is a quick shortcut: 5% or less is low, 20% or more is high.
- You don’t need to be perfect. Even a quick scan of the label gives you more information than guessing.
I have a very specific memory of standing in the cereal aisle about two years into retirement, holding two boxes of granola — both claiming to be “heart healthy” — squinting at the back of each one like I was trying to read a lease agreement in dim lighting.
Serving sizes. Grams. Percentages. A footnote about daily values that seemed to reference a person who eats exactly 2,000 calories and has infinite patience for fine print.
And somewhere in the back of my mind, a voice: “You managed a team of twelve people for twenty years. You can figure out a cereal box.”
Spoiler: it took me longer than I’d like to admit.
The moment that finally made me take this seriously was a granola bar. I grabbed it because it said “natural” on the front and I was feeling virtuous — the kind of virtuous that comes from also having skipped the cookie display two aisles back. Then I flipped it over and actually read the sugar line. It had as much sugar as a candy bar. A candy bar I could have enjoyed openly and without pretending it was a health decision.
That was my “okay, time to actually learn this thing” moment.
Here’s what I’ve come to understand after years of reading labels, talking to my doctor, pestering a registered dietitian with questions, and paying a lot more attention to what I’m actually putting in my body: the nutrition facts label for retirees is genuinely one of the most useful tools we have. It doesn’t have an agenda. It doesn’t care about your feelings or your brand loyalty. It just tells you what’s in the food — quietly, consistently, on the back of almost every package.
And in retirement, when what we eat has a more direct, more immediate impact on how we feel, how we sleep, how our joints behave, and how our hearts hold up — that information matters more than it ever did during our working years.
The front of the package is where the marketing lives. “Made with whole grains.” “Light.” “Natural.” “High protein.” The nutrition facts label on the back is where the truth lives. Once you know how to read it, you’ll never look at a package the same way again.
What Is the FDA Nutrition Facts Label — and Why Does It Exist?

The nutrition facts label is that black-and-white box on the back of packaged foods. Frozen meals, cereals, sauces, snack bars, salad dressings, even the ice cream you keep “for guests” — and occasionally eat alone on a Tuesday afternoon, which is completely fine.
The Food and Drug Administration (FDA) oversees this label. Their job is to make sure the information is accurate, the format is consistent, and you have enough detail to make real decisions — not just marketing-shaped impressions.
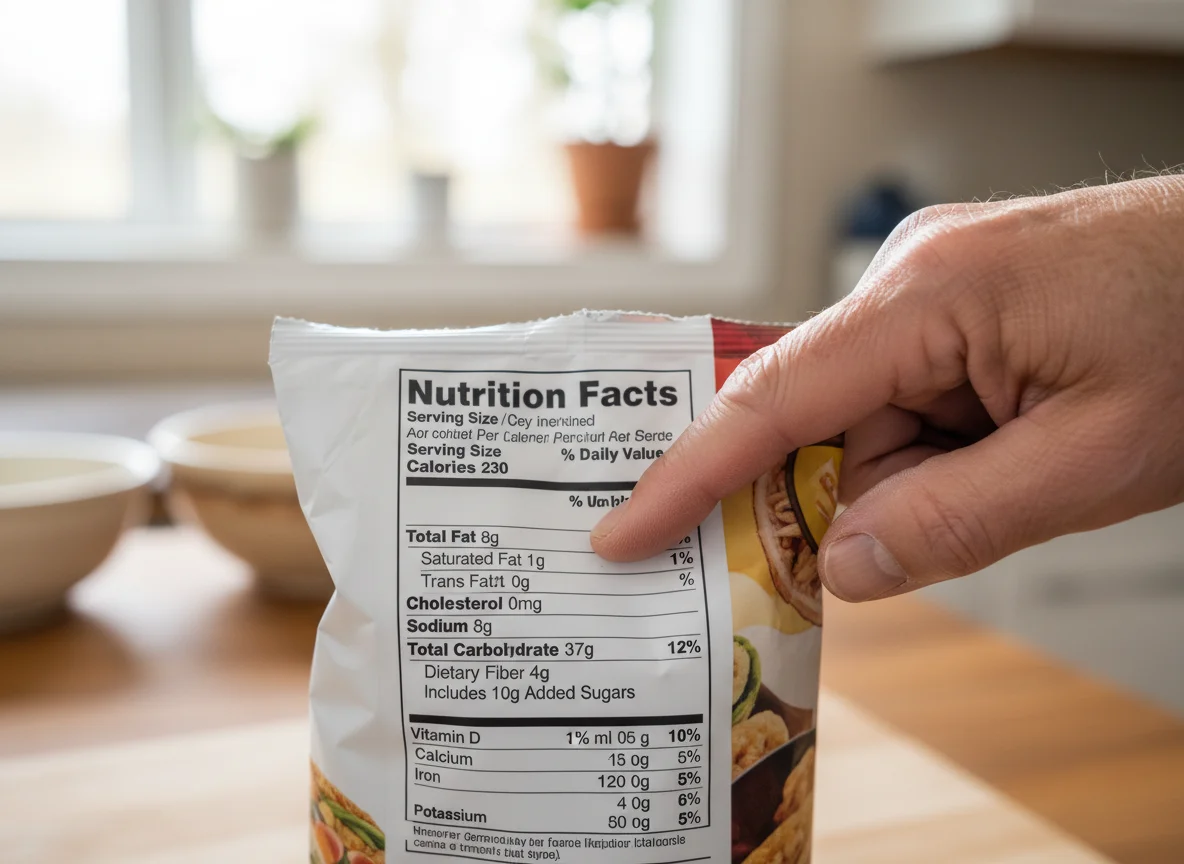
On a standard label, you’ll find — per serving:
- Calories
- Total fat, saturated fat, and trans fat
- Cholesterol
- Sodium
- Total carbohydrates, dietary fiber, total sugars, and added sugars
- Protein
- Key vitamins and minerals: vitamin D, calcium, iron, and potassium
It’s a snapshot of what you’re about to eat. Simple in concept, genuinely powerful in practice.
It hasn’t always existed, by the way. Before the early 1990s, there was no standard requirement for nutrition information on most packaged foods. Some companies shared a lot. Some shared very little. Health claims were loosely regulated and often more marketing than science. If you were grocery shopping in the 1970s or 80s, you were largely going on instinct, habit, and whatever your mother told you was good for you.
That changed with the Nutrition Labeling and Education Act (NLEA) of 1990, which gave the FDA authority to require standardized labels and regulate nutrient and health claims. The result was the nutrition facts label we know today — updated most recently in 2016 to reflect current science and the way people actually eat.
For retirees especially, this matters. Research has consistently found that people who regularly read nutrition labels tend to have healthier diets overall — more fiber, less added sugar, better patterns across the board. Not because the label is magic, but because it hands you real information you can actually use.
Why the Nutrition Facts Label Matters More in Retirement

Here’s something nobody really prepares you for when you’re counting down to retirement: the way your body processes food changes as you age. Not dramatically overnight, but gradually, meaningfully — in ways that start to show up in how you feel after meals, how quickly you get full, how long that fullness actually lasts.
Metabolism slows. Muscle mass naturally decreases unless you’re actively working to maintain it. The kidneys become a little less efficient at processing sodium. Blood pressure tends to creep up. Blood sugar regulation can become less reliable. Bone density requires more intentional nutritional support than it did at forty.
None of this means retirement is a sentence to bland, joyless eating. I want to be very clear about that. It means the nutrition facts label for retirees becomes a more useful tool than it ever was during your working years — because the stakes of what you eat are a little higher, and the payoff of eating well is a little more immediate.
I noticed this shift personally. During my working years, I ate whatever was fast and convenient and didn’t think much about it. My body seemed to handle it fine — or at least, it didn’t complain loudly enough for me to pay attention. Then I retired, and suddenly the feedback loop got shorter. A high-sodium meal and I’d feel puffy and sluggish the next morning. Too much sugar in the afternoon and my energy would crash by 4pm in a way it never used to. Not enough protein and I’d be hungry again an hour after eating.
When my doctor flagged my blood pressure at a routine checkup, the label went from “something I glanced at occasionally” to “something I actually check.” Same with fiber after a conversation about digestive health. Same with added sugars after learning more about blood sugar management.
The label didn’t change. My reasons for caring about it did.
Breaking Down the Nutrition Facts Label: Line by Line
Let’s go through each section so this stops feeling like a code and starts feeling like a conversation between two people who’ve both been confused by this before.
Serving Size and Servings Per Container
This is the starting point. If you skip this line, everything else gets confusing fast — and I mean that literally, not as a figure of speech.
The serving size tells you how much food all the numbers are based on — shown in a familiar unit (“1 cup,” “2 tbsp,” “3 pieces”) and in grams. Right underneath is servings per container, which tells you how many servings the entire package holds.
Here’s the thing most of us learn the hard way: serving size is not a suggestion or a guilt trip. It’s not saying “this is all you’re allowed.” It’s showing you what a typical amount eaten at one time looks like, based on national dietary data. The FDA uses something called Reference Amounts Customarily Consumed (RACC) to set these numbers — which is a very official way of saying “what people actually tend to eat.”
I remember picking up a bottle of juice at the store, thinking “120 calories, not bad.” Then I noticed: servings per container — 2. I’d been drinking the whole bottle in one sitting, assuming it was one serving. That “120 calories” was actually 240. Same story with chips. My “casual handful while watching the news” was often three servings according to the label. Three. I was not eating three servings’ worth of chips. I was eating what felt like a normal amount of chips. The label just had a different definition of normal.
So: always look at serving size and servings per container first. If you eat more than one serving — and most of us do sometimes — just multiply the numbers. No shame. Just math.
For retirees managing weight, blood sugar, or sodium intake, this one line can completely change how you interpret everything else on the label.
Calories
The calorie number is big and bold because it gives a quick sense of how energy-dense a serving is.
In retirement, calorie needs often shift. With a slower metabolism and typically less physical activity than during working years — no more walking to the parking garage, no more running between meetings — many retirees find they need somewhat fewer calories than before. Though this varies widely depending on how active you are and what your health situation looks like.
That said, I’ve stopped obsessing over calories as a standalone number. A 220-calorie snack with fiber and protein feels very different in my body than 220 calories of pure sugar. One keeps me going for hours. The other has me rummaging through the kitchen forty-five minutes later wondering why I’m hungry again.
The calorie number is useful context. It’s not the whole story. The rest of the label fills in what the calorie number can’t tell you on its own.
Total Fat, Saturated Fat, and Trans Fat
Under calories, you’ll see the fat section. It looks more intense than it is — especially if you grew up in the low-fat era of the 1980s and 90s, when fat was basically treated as the villain in every nutritional story.
You’ll usually see:
- Total fat — the sum of all fats in the serving
- Saturated fat — called out because it’s more strongly linked to heart disease risk
- Trans fat — the artificial kind, linked to higher cardiovascular risk; the FDA has largely removed it from the food supply, but it’s worth checking on older or heavily processed products
The label doesn’t always break out the “good fats” — monounsaturated and polyunsaturated — but they’re included in total fat. You’ll find these healthier fats in olive oil, nuts, seeds, avocado, and fish. The kind of fats that actually do your body some good.
For retirees, heart health is often a top priority — and rightly so. When I look at this section, I’m not thinking “no fat ever.” I’m thinking: keep saturated fat moderate, avoid trans fat, and don’t fear total fat if it’s coming from good sources. A handful of mixed nuts and a small bag of chips might have similar total fat numbers on the label, but the story those fats tell for your heart is very, very different.
Cholesterol and Sodium
Cholesterol is listed in milligrams. For most people, dietary cholesterol doesn’t affect blood cholesterol as strongly as saturated and trans fats do — but it still matters for some individuals, particularly those with certain health conditions. Worth tracking if your doctor has flagged it as something to watch.
Sodium is where things get serious for a lot of retirees — and I say that from personal experience, not just from reading about it.
Too much sodium is directly linked to high blood pressure, which raises the risk of heart disease and stroke — two of the leading health concerns in older adults. Most health guidelines suggest aiming for less than 2,300 mg of sodium per day, and some doctors recommend even less for people already managing hypertension.
The catch — and this is the part that surprised me most — is that most of our sodium doesn’t come from the salt shaker at the dinner table. It comes from:
- Canned soups and broths
- Frozen meals
- Processed meats
- Packaged snacks
- Sauces, dressings, and condiments
The first time I really checked the sodium on certain “healthy” frozen meals — the ones marketed with words like “light” and “balanced” — I was genuinely shocked. One tray could easily hit 800–1,200 mg of sodium. Sometimes more. Between that, a snack, and a restaurant meal, it’s easy to blow past your daily limit without trying, without even noticing, without adding a single grain of salt yourself.
The nutrition facts label makes this visible. If sodium is at 30% or 40% of your daily value in one serving, you know you’re dealing with a high-sodium food — and you can plan the rest of your day accordingly instead of being blindsided by it.
Total Carbohydrates, Dietary Fiber, Sugars, and Added Sugars
Carbs get their own section, and this is where a lot of helpful nuance lives — especially for retirees managing blood sugar, digestive health, or weight.
Under Total Carbohydrate, you’ll usually see:
- Dietary fiber — one of the genuinely best lines on the entire label
- Total sugars — naturally occurring plus added
- Added sugars — sweeteners added during processing
Dietary fiber helps with digestion, supports heart health, helps regulate blood sugar, and keeps you feeling full. Most adults don’t get nearly enough of it. Seeing a meaningful amount of fiber on the label — say, 4 or 5 grams per serving — is genuinely good news, the kind worth noticing.
Added sugars got their own separate line in the 2016 label update, and it was a genuine game changer. Before that, you only saw total sugars — a mix of naturally occurring sugars (like those in fruit or milk) and anything added during processing. You had no way of knowing how much of that sugar was natural and how much was poured in at the factory. Now you can see exactly how much sugar was added, and it’s often a number that makes you set the package back down.
Guidelines suggest keeping added sugars to less than 10% of daily calories. For a 2,000-calorie diet, that’s under 50 grams per day.
When added sugars first appeared on labels, a lot of people had genuine “wait, what?” moments. Sweetened yogurt, flavored oatmeal, granola bars, pasta sauces, salad dressings — they often had far more added sugar than anyone realized. Things that felt healthy. Things that had been in the cart for years without a second thought.
Now, when I’m picking cereal or yogurt, I check fiber and added sugars together. More fiber, less added sugar? That’s usually the winner. If I want something sweet, I’d rather choose it on purpose — actually enjoy it — than accidentally spend my sugar budget on salad dressing and wonder why I feel off by mid-afternoon.
Protein
Protein has its own line, measured in grams per serving.
In retirement, protein deserves more attention than most of us gave it during our working years — and I’ll be honest, I didn’t think much about protein until my doctor brought it up. As we age, the body becomes slightly less efficient at using dietary protein to build and maintain muscle — a process researchers call anabolic resistance. This means older adults actually need somewhat more protein per pound of body weight than younger adults, not less. Which is the opposite of what most people assume.
Protein also:
- Supports immune function
- Helps with wound healing and recovery
- Keeps you feeling full longer, which matters a lot if you’re managing weight or trying to avoid the 3pm snack spiral
When I look at snack bars, cereals, or frozen meals, the protein line helps me gauge whether something will actually sustain me or just give me a quick spike and crash. A meal with meaningful protein plus fiber is almost always more satisfying than one without — and the label tells you exactly what you’re working with before you commit.
Vitamins and Minerals
At the bottom of the label, you’ll see key vitamins and minerals — typically:
- Vitamin D — supports bone health and immune function; many older adults are deficient, often without knowing it
- Calcium — essential for bones and teeth; absorption decreases with age, which makes dietary sources more important
- Iron — helps red blood cells carry oxygen
- Potassium — supports healthy blood pressure and fluid balance
These nutrients are highlighted because many people don’t get enough of them — and for retirees, the stakes of deficiency are higher than they were at thirty. Vitamin D and calcium together are particularly important for bone density, which becomes a more pressing concern after 60. A fracture that would have been a minor inconvenience at forty can be a serious setback at seventy.
The %DV shown next to each nutrient is based on a 2,000-calorie diet. Your specific needs may differ — especially if your doctor has recommended higher or lower amounts of certain nutrients — but it’s a useful general yardstick for a quick read.
The % Daily Value: Your Quick Reference Tool
The % Daily Value (%DV) column runs down the right side of the label and is one of the most underused tools on it. Most people glance at it and move on. Once you understand what it’s actually telling you, it becomes the fastest part of the label to use.
Here’s the simple rule:
- 5% DV or less = low
- 20% DV or more = high
That’s it. You don’t need to memorize daily values for every nutrient. You don’t need a calculator. Just use this shortcut.
If saturated fat is at 25% DV, that’s a high-saturated-fat food. If fiber is at 18% DV, that’s a solid fiber source worth noting. If sodium is at 40% DV in one serving, you know to be careful with the rest of your day — because you’ve already used nearly half your daily budget in one meal.
For retirees juggling multiple health considerations — blood pressure, blood sugar, bone health, heart health — the %DV column lets you scan a label quickly and get a meaningful read without doing complicated math in the middle of the grocery aisle.
Health Claims on the Front: What They Actually Mean
The front of a package is where the big promises live:
- “May reduce the risk of heart disease”
- “Supports immune health”
- “Heart healthy”
- “Low sodium”
- “High fiber”
- “Good source of calcium”
The FDA regulates these claims. To use them, companies need scientific evidence and must meet specific, defined criteria. For example:
- “Low sodium” means 140 mg or less per serving
- “Low fat” means 3 grams of fat or less per serving
- “Good source” means 10–19% of the Daily Value for that nutrient
- “High” or “excellent source” means 20% or more
So the claims aren’t meaningless — but they’re also not the full picture. A food can be “low fat” and still be loaded with added sugar. A food can be “high fiber” and still have more sodium than you’d want in one sitting.
My rule is simple: if the front of the package is talking loudly, I flip it over and let the nutrition facts label fact-check the hype. Usually, the label confirms or quietly contradicts whatever the front was promising. The label always wins that argument.
Practical Tips for Using the Label in Retirement

You don’t need to memorize everything or spend half an hour in every aisle. A few simple habits make a real difference — and they get faster with practice.
Start with serving size, every time. It’s home base. Once you know the serving size and how many servings are in the package, everything else makes sense. Skip this step and the rest of the numbers are essentially meaningless.
Use %DV as your quick gauge. Five percent or less is low. Twenty percent or more is high. That’s all you need for a fast read on any nutrient.
Pay extra attention to sodium and added sugars. These two quietly pile up — especially from canned, frozen, and packaged foods. Comparing similar products and choosing the lower-sodium soup or lower-sugar yogurt adds up meaningfully over time, without requiring you to give up anything you actually enjoy.
Don’t fear fat — focus on the type. Keep saturated fat moderate, avoid trans fat, and leave room for healthy fats from nuts, seeds, olive oil, and fish. Fat is not the enemy. The wrong kind of fat, in large amounts, is the issue.
Pair the label with the ingredients list. The nutrition facts tell you how much. The ingredients list tells you what. Together, they paint the full picture. Ingredients are listed from most to least by weight — so if sugar is the second or third ingredient, that tells you something important that the front of the package probably isn’t advertising.
Compare before you commit. The label is most powerful when you use it to compare two similar products side by side. Often a small switch — lower sodium, more fiber, less added sugar — makes a meaningful difference without sacrificing anything you actually care about.
A Note on Special Dietary Needs in Retirement
Many retirees are managing specific health conditions that make certain parts of the label more important than others. The nutrition facts label for retirees isn’t one-size-fits-all — it’s a tool you can use differently depending on what your body needs right now.
- High blood pressure? Sodium is your primary focus. Check it on everything.
- Type 2 diabetes or blood sugar concerns? Total carbohydrates, fiber, and added sugars deserve close attention.
- Heart disease or high cholesterol? Saturated fat and trans fat are the key lines.
- Osteoporosis or bone health concerns? Vitamin D and calcium are worth tracking at every meal.
- Trying to maintain muscle mass? Protein per serving matters more than you might think — and more than most people prioritize.
Those needs may also shift over time as your health picture evolves. What you focused on at 62 might look different at 72. The label stays the same. What you’re looking for on it changes with you.
If you’re managing a specific condition, it’s worth asking your doctor or a registered dietitian which parts of the label deserve the most attention for your situation. The label gives you the data. Your healthcare team helps you interpret what it means for you specifically — and that combination is genuinely powerful.
Wrapping It Up: Your Nutrition Facts Label, Your Health Ally
The nutrition facts label can look intimidating, but it’s not your enemy. It’s more like a quiet, honest friend who always tells the truth — even when the front of the package is trying a little too hard to impress you.
Once you understand how to read it — serving size, calories, fats, sodium, carbs, fiber, sugars, protein, vitamins, and minerals — you can walk through the grocery store with a lot more confidence. You don’t need to calculate every gram or become “that person” reading every label for half an hour. Even a quick scan gives you useful, actionable information that guessing simply can’t.
In retirement, eating well isn’t about perfection or deprivation. It’s about awareness. It’s about knowing what you’re actually eating so you can make choices that support the life you want to live — with energy, with clarity, and with enough good health to enjoy the years you’ve worked so hard to reach.
Next time you’re shopping, grab one thing you buy regularly and really look at its nutrition facts label. See if it matches what you thought you were eating. If it does, great — you just confirmed it. If it doesn’t, you get to decide whether it’s still worth it or if there’s a better option nearby.
Either way, you’re not in the dark anymore.
And that quiet little black-and-white box on the back of the package? It’s been on your side the whole time. You just needed to know how to read it.


One Comment
Comments are closed.